The Stochastic Oscillator is a momentum indicator which tracks the current location relative to the high-low range in a set number of periods. As a momentum indicator it changes direction before price. The Stochastic Oscillator is calculated as follows:
%K = (Current Close - Lowest Low)/(Highest High - Lowest Low) * 100
The StochRSI is the Stochastic calculation applied to RSI. This makes StochRSI an indicator of an indicator. The calculation is the following:
StochRSI = (RSI - Lowest Low RSI) / (Highest High RSI - Lowest Low RSI)
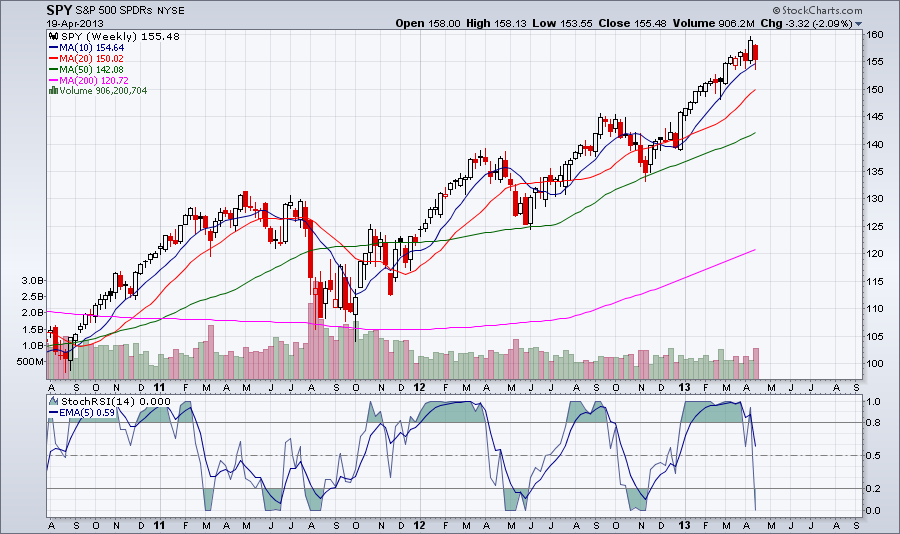
StochRSI moves between 0 and 1. This momentum indicator can be used to identify trends, trend reversals, oversold and overbought conditions.
The chart below shows the weekly chart for SPY with StochRSI. As you can see StochRSI moved to 0 but the 5 period EMA of StochRSI is still above 0.5. When in previous instances SPY moved to 0 it signaled the beginning of a medium-term correction. Also notice heavier selling volume.
%K = (Current Close - Lowest Low)/(Highest High - Lowest Low) * 100
The StochRSI is the Stochastic calculation applied to RSI. This makes StochRSI an indicator of an indicator. The calculation is the following:
StochRSI = (RSI - Lowest Low RSI) / (Highest High RSI - Lowest Low RSI)
StochRSI moves between 0 and 1. This momentum indicator can be used to identify trends, trend reversals, oversold and overbought conditions.
The chart below shows the weekly chart for SPY with StochRSI. As you can see StochRSI moved to 0 but the 5 period EMA of StochRSI is still above 0.5. When in previous instances SPY moved to 0 it signaled the beginning of a medium-term correction. Also notice heavier selling volume.


 RSS Feed
